

Getting started
This guide takes you from a fresh install to a finished, exported takeoff. It should take about twenty minutes, and you only have to do most of it once.
If you read nothing else, read Step 5: set the drawing scale. Every area, length and volume in your takeoff is derived from it, so a wrong scale means every quantity is wrong by the same factor.
What PixelTakeoff does
Section titled “What PixelTakeoff does”PixelTakeoff turns construction PDFs into measured quantities. Point at what you want on a drawing and it measures it: areas of paving, lengths of edging, volumes of base, counts of fixtures.
It is a local-first desktop application. Your drawings live in a workspace folder on your own machine rather than being uploaded to a project server.
Step 1: install
Section titled “Step 1: install”- Run the installer you were sent.
- On Windows you will see a “Windows protected your PC” message the first time. This is SmartScreen reacting to a new publisher, not a problem with the file. Click More info, then Run anyway.
- Follow the installer prompts and launch PixelTakeoff.
If your IT team screens software, give them the SHA-256 checksum supplied with your download so they can verify the file is exactly the one we published.
Step 2: activate your license
Section titled “Step 2: activate your license”On first launch you will be asked for a license key.
- Paste the key you were issued.
- Click Activate.
A license is tied to one machine. To move to a different computer, deactivate this one first from Settings → License & Activation → Deactivate this device, which frees the seat so you can activate elsewhere. Contact support if you no longer have access to the old machine.
See Settings for everything on that screen.
Step 3: know where your work is stored
Section titled “Step 3: know where your work is stored”PixelTakeoff keeps your projects in a workspace folder in the standard application data location for your operating system. You do not need to choose it or set it up.
To find it, go to Settings → Advanced → Data Location, which shows the Workspace path and lets you copy it to the clipboard.
Make a note of it now, because that folder is your work. Point your usual backup at it, the same way you would with any other job records. There is more on keeping copies in Projects, drawings and your workspace.
Step 4: create a project and add a drawing
Section titled “Step 4: create a project and add a drawing”Work is organised in three levels:
Project (a job, for example “Marina Villas”) contains Drawing Sets (a revision or discipline, for example “Landscape Rev C”), which contain Drawings (individual sheets).
Create the project
Section titled “Create the project”From the home screen, start a new project, give it a Project Name, and click Create Project.
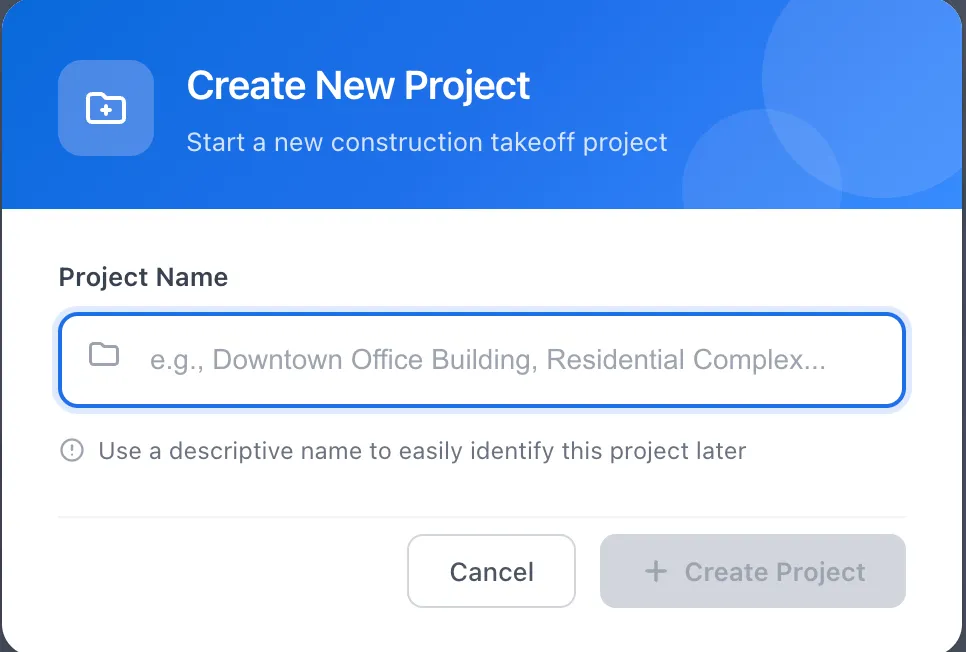
Name it the way your business refers to the job. You will be searching these in a year, so “Marina Villas” beats a code only you recognise.
Add a drawing set
Section titled “Add a drawing set”Inside the project, create a drawing set, give it a Drawing Set Name, and click Create Drawing Set.
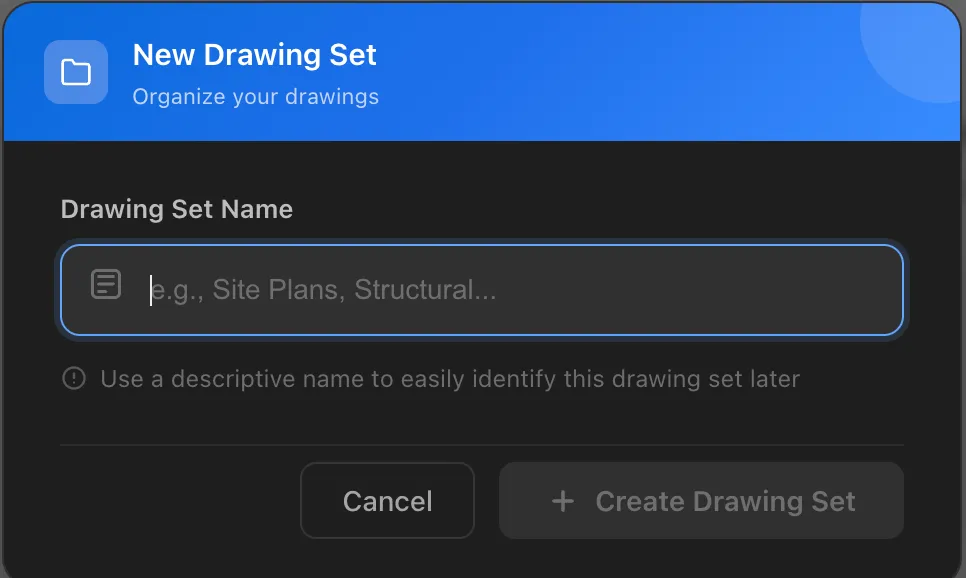
Name it for the revision or discipline, for example “Site Plans” or “Landscape Rev C”. Keeping each revision as its own set is what lets you compare them later instead of overwriting work when a revision arrives.
Add your drawings
Section titled “Add your drawings”Open Add Drawings, then either drag your PDFs onto the drop area or click Browse Files. Several can be added at once.
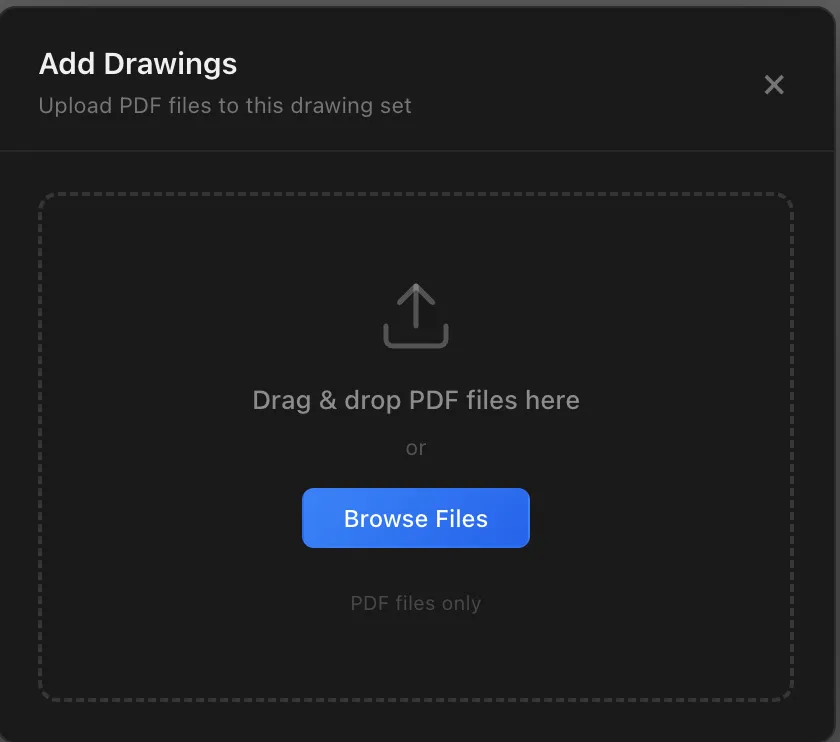
The drawing opens in the editor once processing finishes. Large sheets take longer the first time, and are faster on subsequent opens.
Step 5: set the drawing scale
Section titled “Step 5: set the drawing scale”Do this before you measure anything. PixelTakeoff will not let you create regions until a scale is set, because a measurement without a scale has no meaning.
You have two ways to set it.
If you know the scale
Section titled “If you know the scale”The Scale control in the toolbar reads Not Set until you set one. Click
the scale icon  to open the Drawing scale dialog.
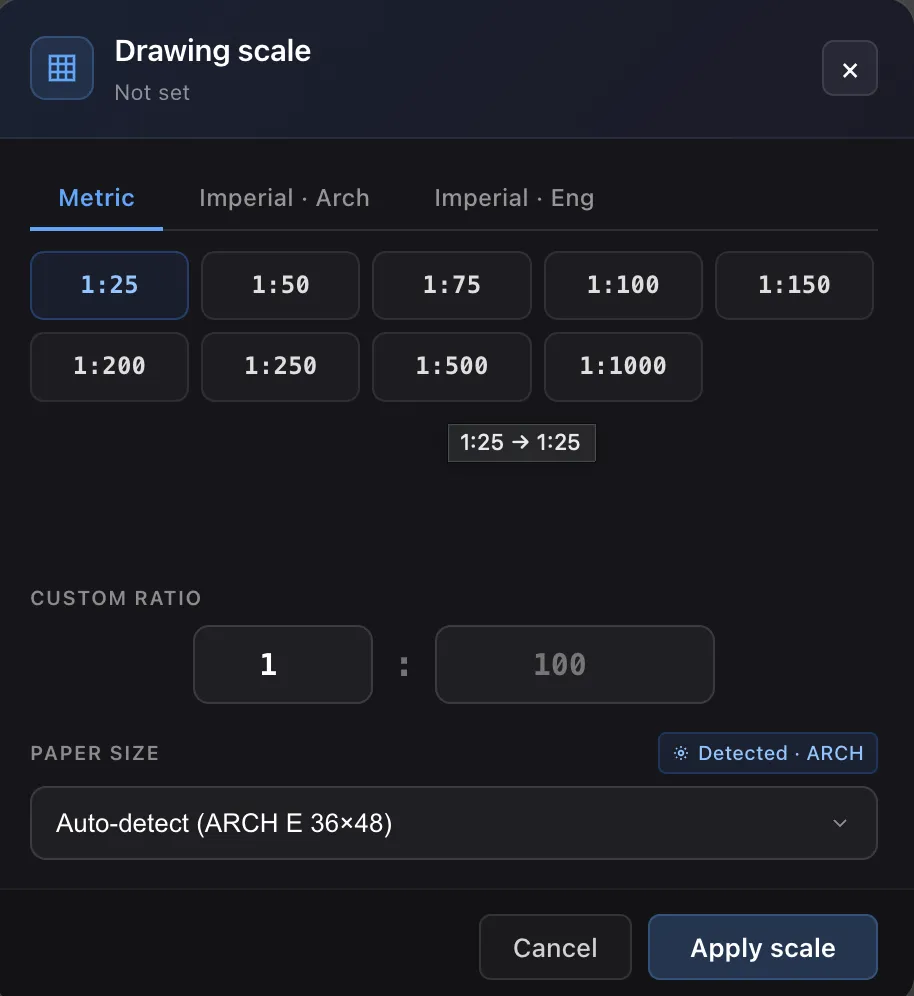
Pick your unit system (Metric, Imperial · Arch or Imperial · Eng), click the preset that matches the drawing, then click Apply scale. If your scale is not listed, use Custom Ratio underneath.
Architectural sheets normally print their scale in the title block.
If you do not know the scale, or the sheet has been resized
Section titled “If you do not know the scale, or the sheet has been resized”Use a known dimension on the drawing instead. This is the more reliable method, because PDFs are often scaled when printed or exported.
- Click
 Calibrate Scale, the button beside the Scale control. This is
its own route, not the Measure Width tool.
Calibrate Scale, the button beside the Scale control. This is
its own route, not the Measure Width tool. - Click one end of something whose real length you know, such as a dimensioned wall or a scale bar, then click the other end.
- Check the measurement, then click Calibrate. If a click landed off, press
Escand measure again. - Enter the real length of what you measured, then click Apply.
PixelTakeoff calculates the scale from what you measured. The result is rounded to the nearest whole scale, which absorbs the slight imprecision in where your clicks landed and settles on the drawing’s intended scale.
Check it before you go further
Section titled “Check it before you go further”Measure a second known dimension and confirm it reads correctly. Thirty seconds here protects the entire takeoff.
Step 6: set up your region
Section titled “Step 6: set up your region”Before your first click, tell PixelTakeoff what you are about to measure.
- Select the Region tool (
R). - In the right panel, type a Region Name, for example “Paving”.
- A colour is already chosen. Change it if you want.
Name and colour together define a group, and groups carry the totals you price from. Everything you take off as “Paving” in the same colour adds into one figure.
That is all you need to start. A new region measures area only, since perimeter and volume are off by default. If this job needs either, turn them on now rather than later, because they apply to work you do after setting them.
Boundary Adjust is the one thing that is on by default, at +2px on the outer edge, which nudges the measured boundary very slightly outward. Leave it unless you have a reason not to, and keep it consistent across a job.
Setting up a new region covers the whole panel: every setting, what it does, and the full list of defaults.
Step 7: take off your first area
Section titled “Step 7: take off your first area”Now click inside the area you want on the drawing.
PixelTakeoff detects the enclosed area you clicked, fills it, and shows its measurement. The region appears in the panel on the right with its quantity.
Repeat for each area of the same material. Every click adds to the same group total as long as the name and colour are unchanged.
If the fill spreads too far or stops too early
Section titled “If the fill spreads too far or stops too early”The Color Tolerance setting controls how closely colours must match for the tool to treat them as the same area. It defaults to 8.
- Fill escaped into areas you did not want: lower the tolerance.
- Fill stopped short of where it should reach: raise it.
Adjust it in Region Settings, then click again. If a boundary on the drawing
is broken (a gap in a line), use Manual Border (B) to draw a temporary
barrier that closes the gap, then fill again.
Step 8: read your measurements
Section titled “Step 8: read your measurements”Each region shows its quantities. Depending on what you have enabled, you may see:
| Symbol | Meaning |
|---|---|
| A | Area |
| Pₙ | Net perimeter, the outer edge plus the edges of any holes |
| Pₑ | External perimeter, the outer edge only |
| Pᵥ | Void perimeter, the edges of holes only |
| V | Volume |
| L | Linear length |
| N | Count |
Perimeter is split three ways because they price differently. Edging around the outside of a lawn is Pₑ, while edging that also goes around planting beds cut into it is Pₙ.
To get volume, set a depth on the group. Volume is area multiplied by depth, so a 120 m² area at 150 mm gives 18 m³.
You can switch between metric and imperial at any time in Settings. This changes only how numbers are displayed, never what was measured.
Step 9: the other takeoff tools
Section titled “Step 9: the other takeoff tools”Areas are one of several kinds of quantity. Each of these has its own page in this documentation, but in short:
| Tool | Shortcut | Use it for |
|---|---|---|
| Region | R | Standard enclosed areas |
| Precision Region | P | Areas needing finer control over what is included |
| Expand Region | X | Growing an existing region outward |
| Inclusive Region | I | Areas defined by what to keep rather than what to exclude |
| Shape | S | Boxes, circles, ellipses and polygons drawn by hand |
| Free Trace | F | Drawing freehand around an irregular area |
| Color Sweep | D | Picking up every area sharing a colour at once |
| Linear Region | L | Lengths: edging, kerbs, pipe runs, fencing |
| Count | C | Placing markers on repeated items |
| Auto Count | A | Finding every instance of a symbol automatically |
| Eraser | E | Removing part of a region |
| Zone | Z | Restricting a takeoff to part of the sheet, such as one phase |
| Markup | M | Notes, clouds, callouts and highlights |
| Inspect | V | Selecting anything without drawing |
| Magnifier | H | Working accurately on dense drawings |
Step 10: organise with groups and layers
Section titled “Step 10: organise with groups and layers”Every region belongs to a group defined by its name and colour. Groups are what you actually price from, since they carry the totals.
In the layer panel on the right you can rename a group, change its colour, hide it while you work on something else, and read its total. Hiding a group takes it out of the visible drawing and out of the totals, which is a quick way to check one material in isolation.
Step 11: save and export
Section titled “Step 11: save and export”Your work saves as you go. To produce something to send:
- Export a takeoff sheet to produce a PDF of the drawing with your regions drawn on it and a summary table of quantities.
- Export to Excel when you want the numbers in a spreadsheet to price.
The summary table shows one row per group, with its colour, its name and its quantities, so the recipient can match a number on the sheet to a colour on the drawing.
Where to go next
Section titled “Where to go next”- Setting the scale correctly for the full detail on calibration
- Region tools in depth for choosing the right tool for a shape
- Linear takeoff for lengths, widths and derived areas
- Counting for manual and automatic counting
- Zones for splitting a drawing by phase or area
- Exporting for sheet and spreadsheet output options
Getting help
Section titled “Getting help”If something is not behaving as described here, go to Settings → Advanced → Export Support Bundle. That produces a single file containing diagnostic logs with no drawing content in it. Send it to support and it usually tells us straight away what went wrong.